VUG and QQQ are both ETFs that track the performance of US growth stocks.
One major difference between VUG vs QQQ is that VUG has exposure to twice the number of stocks as QQQ.
QQQ’s expense ratio is also 5x that of VUG.
You can invest in partial shares of QQQ and SPY at M1 Finance.
Although VUG has more stocks and has lower fees, QQQ has outperformed VUG consistently in the past. We’ll discuss why and which ETF might perform better in the future below.
VUG vs QQQ Comparison
VUG is an ETF that tracks the performance of the CRSP US Large Cap Growth Index.
QQQ on the other hand tracks the Nasdaq 100 index.
VUG holds 265 stocks and QQQ holds 101 stocks. Major stocks excluded from QQQ include Visa, Home Depot, and Disney.
| QQQ | VUG | |
| Assets Under Management | $169bn | $162bn |
| Expense Ratio | 0.20% | 0.04% |
| Number of Holdings | 101 | 265 |
| Inception Date | 3/10/1999 | 1/26/2004 |
| Dividend Yield | 0.44% | 0.46% |
VUG and QQQ have similar levels of assets under management. VUG has $162bn and QQQ has $169bn.
Their dividend yields are comparable as there is a high level of portfolio overlap between the 2 ETFs.
QQQ vs VUG Performance
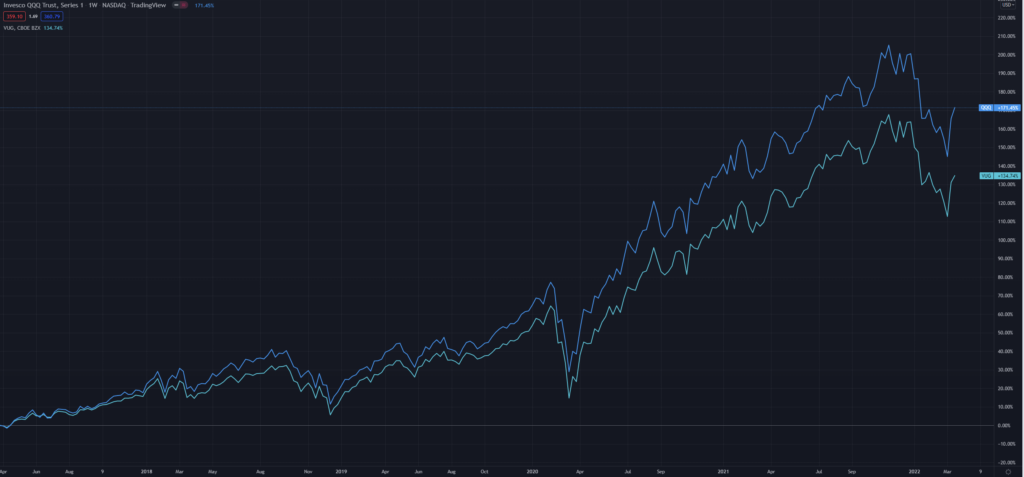
The price-performance of QQQ and VUG are highly correlated. However, QQQ has outperformed VUG over most historical time frames.
QQQ has returned 15.4%, 94.6%, and 171.5% on a 1, 3, and 5-year timeline. Over the same periods, VUG share performance has been 13.7%, 78.4%, and 134.7%.
| VUG Performance | QQQ Performance | |
| 1 Year Performance | 13.7% | 15.4% |
| 3 Year Performance | 78.4% | 94.6% |
| 5 Year Performance | 134.7% | 171.5% |
Given the focus on US stocks, a good benchmark to compare QQQ and VUG is the S&P 500.
The S&P 500 has returned 16.2%, 56.9%, and 92% over the past 1, 3, 5 years.
Both VUG and QQQ have outperformed the S&P significantly over the long term although they have underperformed recently.
QQQ has outperformed VUG handily though. Why is this the case?
Although VUG has exposure to additional high-growth stocks, the stocks of America’s growth companies have done better than these additional stocks.
Much of this outperformance has been driven by the FANG stocks – Facebook, Apple, Netflix, and Google.
Fee Differences
The expense ratio of VUG is 0.04% vs QQQ at 0.20%.
That’s a 5x difference per dollar invested.
However, if you look at the price performance of QQQ vs VUG over the last couple of years, your portfolio would have gone up more if you went with QQQ.
If you had $10,000 in QQQ, you’d pay $20 a year while you’d pay $4 for $10,000 in VUG.
Where Can I Buy VUG Or QQQ?
QQQ and VUG are among the biggest ETFs in the world. You can buy them at most brokerage accounts.
However, we recommend checking out M1 Finance because they allow you to buy partial shares.
Buying partial shares is helpful because you get to fully invest the amount you want to rather leave money on the table because a share costs a couple hundred dollars each.
VUG vs QQQ Statistics
VUG has an 80% overlap with QQQ while QQQ has a 65% overlap with VUG.
The stocks most heavily weighted in QQQ that are not in VUG are Broadcom, Cisco, and Pepsi.
For VUG, the biggest stocks not in QQQ are Visa, Home Depot, and Mastercard.
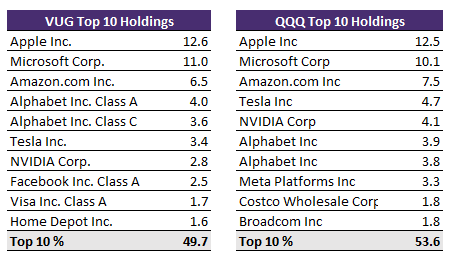
In VUG, the top 10 stocks account for 48.5% of the fund while for QQQ, they account for 53.6% of the fund.
A major difference between the two ETFs is that QQQ excludes financial companies like banks and payment companies.
In VUG, the top 10 stocks account for 48.5% of the fund while for QQQ, they account for 53.6% of the fund.
QQQ Overview
QQQ is an ETF that tracks the Nasdaq 100 Index.
As it suggests, the Nasdaq 100 index has 100 stocks. The Nasdaq 100 holds the 100 largest non-financial companies listed on the Nasdaq.
It is rebalanced quarterly and is offered by Invesco.
Invesco is one of the largest investment companies in the world. It has $1.6 trillion assets under management of which QQQ accounts for 10%.
Many investors use QQQ as a proxy for growth stocks. Besides QQQ, you can also get TQQQ and SQQQ which are leveraged versions of QQQ.
SQQQ actually is an inverse fund where you can bet that the index represented by QQQ goes down.
You can learn more about the differences between QQQ vs other popular indexes like SPY here.
Vanguard Growth ETF (VUG) Overview
VUG is the Vanguard Growth ETF. It tracks the CRSP US Large Cap Growth Index.
CRSP stands for the Center for Research in Security Prices. For the index VUG tracks, it focuses on the following factors:
- Future long term EPS growth
- Future short term EPS growth
- 3-year historical growth in EPS
- 3-year historical growth in sales per share
In other words, it focuses on growth stocks rather than value stocks and has a bit of a momentum tilt.
Overall stocks in VUG trade at a 31.7x Price/Earnings ratio and have a 28.3% earnings growth rate.
VUG is offered by the Vanguard Funds. Vanguard is one of the world’s largest investment companies. It focuses on low-cost ETFs.
At $162bn of AUM, VUG is a significant contributor to Vanguard’s $7.3 trillion of AUM.
Another big Vanguard fund is VTI.
What’s Your Pick – VUG or QQQ?
To recap, the big difference between QQQ vs VUG is that both funds have similar exposure, but QQQ has higher fees.
The performance of QQQ has more than made up for that historically.
Personally, I used to put most of my growth fund investments in VUG but after doing deeper research, I prefer allocating to QQQ.
If you’ve decided which is the right ETF for you, check out M1 Finance.
They allow you to buy partial shares and they have awesome customer service.