QQQ is an ETF that tracks the Nasdaq 100. It is widely used by investors as a cheap way to buy a basket of growth stocks.
SPY is an ETF that tracks the performance of the S&P 500. It is the largest ETF by assets in the world.
One of the big differences between QQQ vs SPY is that QQQ has a much higher allocation to tech stocks and no exposure to financial companies. The expense ratio of QQQ is more than double that of SPY.
You can invest in partial shares of QQQ and SPY at M1 Finance. These index funds are quite different, and we discuss more about the key differences below.
SPY vs QQQ Comparison
The Invesco QQQ Trust, Series 1 (QQQ) and SPDR S&P 500 Trust (SPY) are some of the most popular ETFs in the world.
QQQ is used as a proxy for investing in growth stocks. SPY is used by people who want to invest in large-cap US companies.
QQQ has $169bn in AUM while SPY has $385bn.
| SPY | QQQ | |
| Assets Under Management | $385bn | $169bn |
| Expense Ratio | 0.095% | 0.020% |
| Number of Holdings | 508 | 101 |
| Inception Date | 1/22/1993 | 3/10/1999 |
| Dividend Yield | 1.32% | 0.44% |
QQQ has 101 holdings and tracks the Nasdaq 100 Index. SPY holds 508 stocks and tracks the S&P 500.
QQQ has historically had a much lower dividend yield compared to SPY.
This is because QQQ focuses on growth stocks. Companies focused on growth generally have greater reinvestment needs which lead to them returning less money to shareholders.
Both funds have been around for over 20 years.
QQQ vs SPY Performance
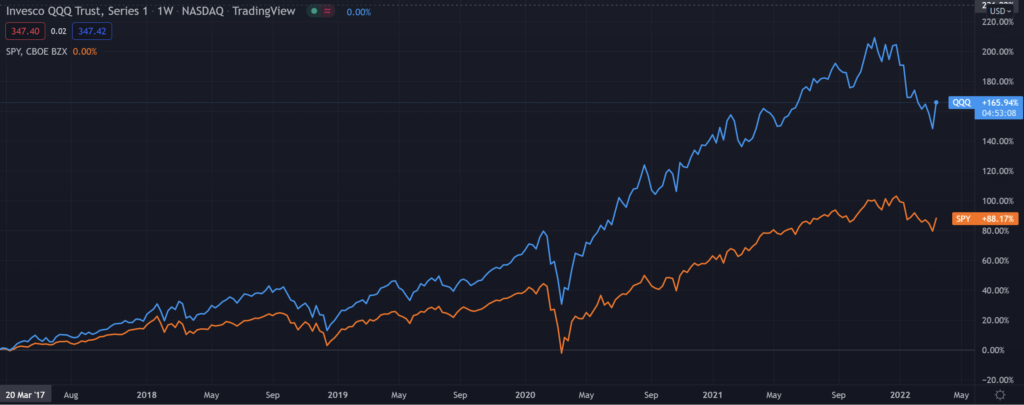
SPY’s 1, 3 and 5-year performance has been 12.5%, 64.2%, and 102.1%.
Over the same time periods, QQQ has returned 6.7%, 94.7%, and 167.5%.
| SPY Performance | QQQ Performance | |
| 1 Year Performance | 12.5% | 6.7% |
| 3 Year Performance | 64.2% | 94.7% |
| 5 Year Performance | 102.1% | 167.5% |
A fair benchmark to comp SPY and QQQ is the S&P 500. The S&P 500 has returned 12.9%, 61.2% and 88.5% over the past 1, 3, 5 years.
SPY tracks the S&P 500 so its performance tracks very closely.

QQQ has materially outperformed the S&P 500 on a 3 and 5-year basis.
This is due to growth stocks outperforming value stocks and QQQ’s higher weighting to large-cap tech stocks.
Companies like Microsoft and Google have been able to grow their earnings and market cap massively over the past couple of years.
Right now QQQ is underperforming on a one-year basis because tech stocks have fallen out of favor and valuation multiples have gone down as investors fear the impact of higher interest rates.
Fee Differences
The management fee of QQQ is 0.20% and the expense ratio for SPY is 0.0945%.
The fee for $10,000 in SPY is $9.45 a year and the fee for $10,000 in QQQ is $20.
On average, the expense ratio of equity index funds is 0.58%. For equity mutual funds, the average management fee is 1.16%.
While QQQ has higher annual fees than SPY, in the past it has outperformed SPY by such a degree to more than offset the higher fees.
Where Can I Buy QQQ Or SPY?
SPY and QQQ are available at most brokerage accounts. If you plan on investing, we suggest finding a brokerage that will let you buy partial shares.
Making your buy with partial shares allows you to put exactly how much you want to invest rather than more or less due to the high cost of buying a full share.
I use M1 Finance for my partial share buys.
QQQ vs SPY Differences
QQQ and SPY hold many of the same stocks. In our cross-shareholding analysis, there was a 93.1% overlap between the holdings of the two ETFs.
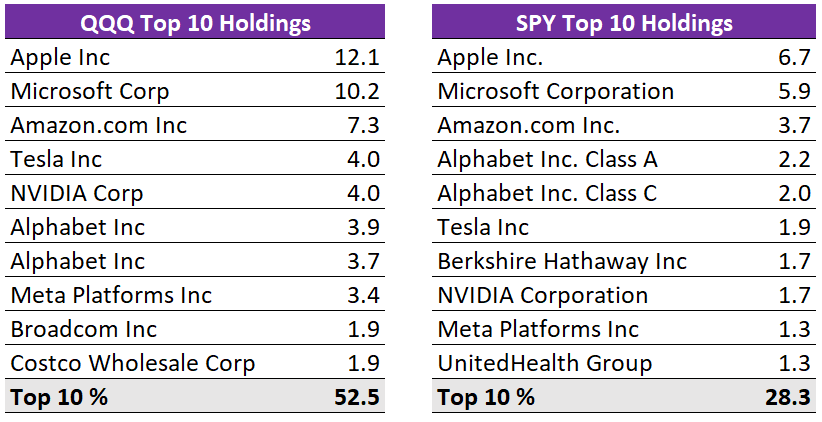
The top 3 holdings of QQQ and SPY are identical. They are Apple, Microsoft, and Amazon.
Where there are major differences are on the weightings of the top 10 stocks for each ETF.
For QQQ, the top 10 stocks accounted for 48.7% of the portfolio while for SPY, the top 10 stocks only accounted for 28.3% of the portfolio.
On average, QQQ has a 2x weighting to shared large-cap tech stocks like Amazon and Facebook.

Sector weights are another key driver of variant returns.
For QQQ, information technology is 50.4% of the index vs 27.6% for SPY.
Healthcare is the second largest sector for SPY at 13.8% but is only 5.9% for QQQ.
SPY Overview
SPDR S&P 500 ETF Trust (SPY) tracks the S&P 500. It is managed by State Street Global Advisors and was the first exchange-traded fund listed in the United States.
Since it tracks the S&P 500, State Street is not responsible for the index composition – Standard and Poors is.
Standard and Poors created the S&P 500 to track diversified large-cap US firms.
They have a wide amount of discretion in terms of adding or removing stocks. We saw this when Tesla was added to the index.
Since SPY and other index funds that track the S&P have so many assets under management, when companies are added or removed from the index, billions of dollars move in just a couple of days.
A good alternative for SPY is VTI. VTI has the same stocks as SPY as well as other mid and small-cap American stocks. Its expense ratio is also half that of SPY.
You can learn more about the differences between VTI vs SPY here.
Invesco QQQ Trust Series 1 Overview
The Invesco QQQ Trust Series 1 (QQQ) is an ETF consisting of all the stocks in the Nasdaq 100 Index.
It holds the 100 largest domestic and international companies listed on the Nasdaq Stock Market. It does not include financial companies like banks and insurers.
The index is rebalanced quarterly.
QQQ is offered by Invesco, an American global investment company. Invesco has $1.6 trillion dollars of AUM of which QQQ accounts for 10%.
QQQ is also the official ETF of the NCAA if that matters to you.
If you’re looking for alternatives to QQQ, VUG is a decent option. VUG tracks US Large Cap growth stocks and has an expense ratio of 0.04% vs 0.20% for QQQ.
Over the past 5 years though, QQQ has outperformed VUG by much more than the difference in the annual fees for the index. Learn more about VUG vs QQQ here.
What’s Your Pick – QQQ or SPY?
These are the main differences between QQQ vs SPY that we found in our research.
If you’re ready to invest, dollar cost averaging with partial shares is a good financial habit to have.
M1 Finance offers a brokerage account with these features that you can check out.
